How to Analyze and Monitor Campaigns?
The ‘Campaigns‘ page on our affiliate platform allows you to analyze and monitor existing campaigns.
To monitor a Campaign, navigate to your dashboard, select ‘Statistics’, and then click ‘Campaigns‘.
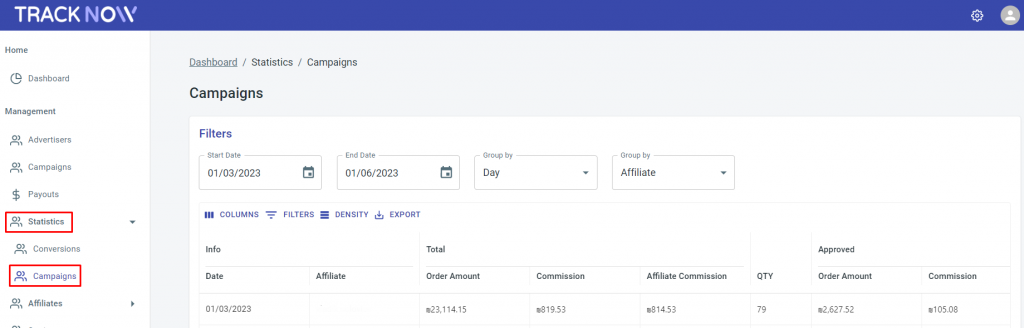
Here’s an explanation of each search field:
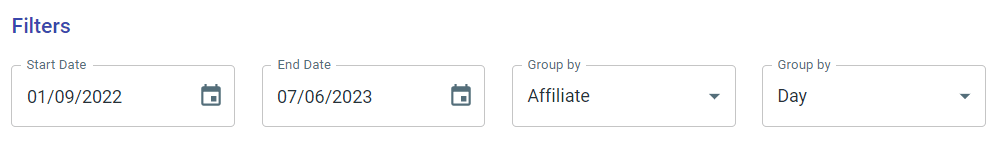
Start Date and End Date – Specify the starting and ending date for the timeframe you want to analyze the campaigns.
Group by – Filter campaigns based on the Campaign / Affiliate / Day / Month / Year you wish to analyze.
Explanation of each column in the conversions grid:
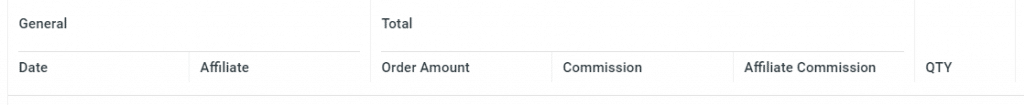
Date – This field represents the date on which a particular conversion or transaction occurred. It allows you to track the timeline of your campaign’s performance and analyze trends over time.
Affiliate – This field displays the affiliate’s name who generated the conversion for the specific campaign. It helps you identify which affiliates are driving the most traffic and conversions for your campaign.
Order Amount – This field shows the total amount of the order associated with the conversion.
Commission – This field indicates the commission amount earned for the specific campaign.
Affiliate Commission – This field displays the commission amount paid to the affiliate for their contribution to the conversion. It reflects the actual payout made to the affiliate based on the commission structure defined in the campaign.
QTY – This field represents the number of conversions generated by an affiliate. It helps you measure the volume of conversions driven by each affiliate and evaluate their effectiveness in promoting your campaign.
Customize your grid with the following buttons:

Columns – This control allows you to customize the display of columns in the grid. You can find specific columns by searching, hide all columns to simplify the view, or show all columns to include all available data.
Filters – The filter control enables you to apply specific criteria to filter the data in the grid. This helps refine the information displayed based on your desired parameters, allowing for more focused analysis and insights.
Density – The density control allows you to adjust the width or thickness of the table in the grid. You can make the table wider to display more information at once or make it more compact to save space, depending on your preference and the amount of data you need to view.
Export – The export button allows you to download the grid data in a downloadable file format. This feature enables you to extract the information from the grid for further analysis or sharing with others, such as creating reports or conducting offline data analysis.

If you have any issues regarding campaigns, please contact the ‘Tracknow’ Support Team by clicking ‘here‘, we will do our best to answer all your inquiries.